A Study of Ego Behaviour Pattern Changes in Dreams
2026-05-18I have a fairly large database of my recorded dreams, and after coming across the hypothesis proposed by Christian Roesler in his article[1], I decided to test it.
Roesler proposes classifying dreams according to the behaviour pattern of the dreamer’s ego, dividing them into five types. Each type describes the complexity with which the ego interacts with other objects in the dream.
- The dream ego is absent
- The dream ego is under threat
- The dream ego needs to assert itself
- Dream about movement
- Dream about social interaction
So does the complexity of our ego behaviour in dreams always increase over the course of successful therapy?
Roesler’s Hypothesis
Hypothesis: SDA pattern levels rise over the course of therapy (that is, a shift occurs over time from lower types to higher ones).
Or, as the author himself put it:
We would also hypothesize that there is a typical change in dream patterns over the course of successful therapies.
[…]
These transformative patterns in the dream series are interpreted from a psychodynamic perspective and are seen as speaking to the fact that an initially weak ego structure, which fails to regulate and integrate threatening emotions, impulses and complexes, gains in ego strength over the course of the therapy and increasingly succeeds in coping with initially suppressed or split off parts of the psyche and integrating these into constructive interactions with others.
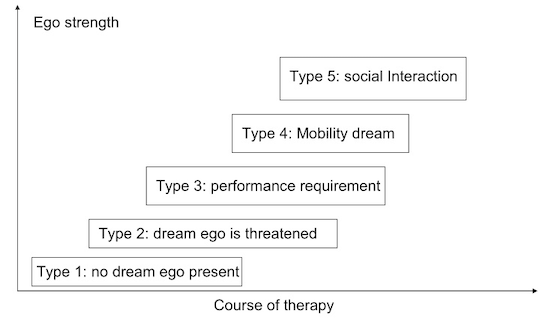
Changes in dream patterns over the course of therapy in connection with improvements in ego strength
Dream Database
For the study, the dreams of a single patient were analysed using the Gemini and Claude AI models. The results of the dream analysis (excluding descriptions of the dreams themselves and the rationale behind the classification) are attached as a separate archive.
Excluded from further analysis:
- 6 dreams that could not be classified,
- 3 dreams from 2018.
The table below shows the statistics for the data, to give a sense of the distribution of results.
- Total dreams: 1111
- Date range: from 2020-06-07 to 2026-05-09
| Year | Pattern 1, % | Pattern 2, % | Pattern 3, % | Pattern 4, % | Pattern 5, % | Total dreams |
|---|---|---|---|---|---|---|
| 2020 | 0 | 9.1 | 22.7 | 18.2 | 50 | 44 |
| 2021 | 4.2 | 14.6 | 28.5 | 11.1 | 41.6 | 144 |
| 2022 | 0.8 | 16.3 | 34.9 | 6.5 | 41.5 | 123 |
| 2023 | 1.1 | 11.1 | 30 | 12.1 | 45.7 | 280 |
| 2024 | 2.2 | 12.3 | 30.7 | 9.2 | 45.6 | 228 |
| 2025 | 0.5 | 11.1 | 35.8 | 13.7 | 38.9 | 226 |
| 2026 | 1.5 | 13.6 | 30.3 | 13.6 | 40.9 | 66 |
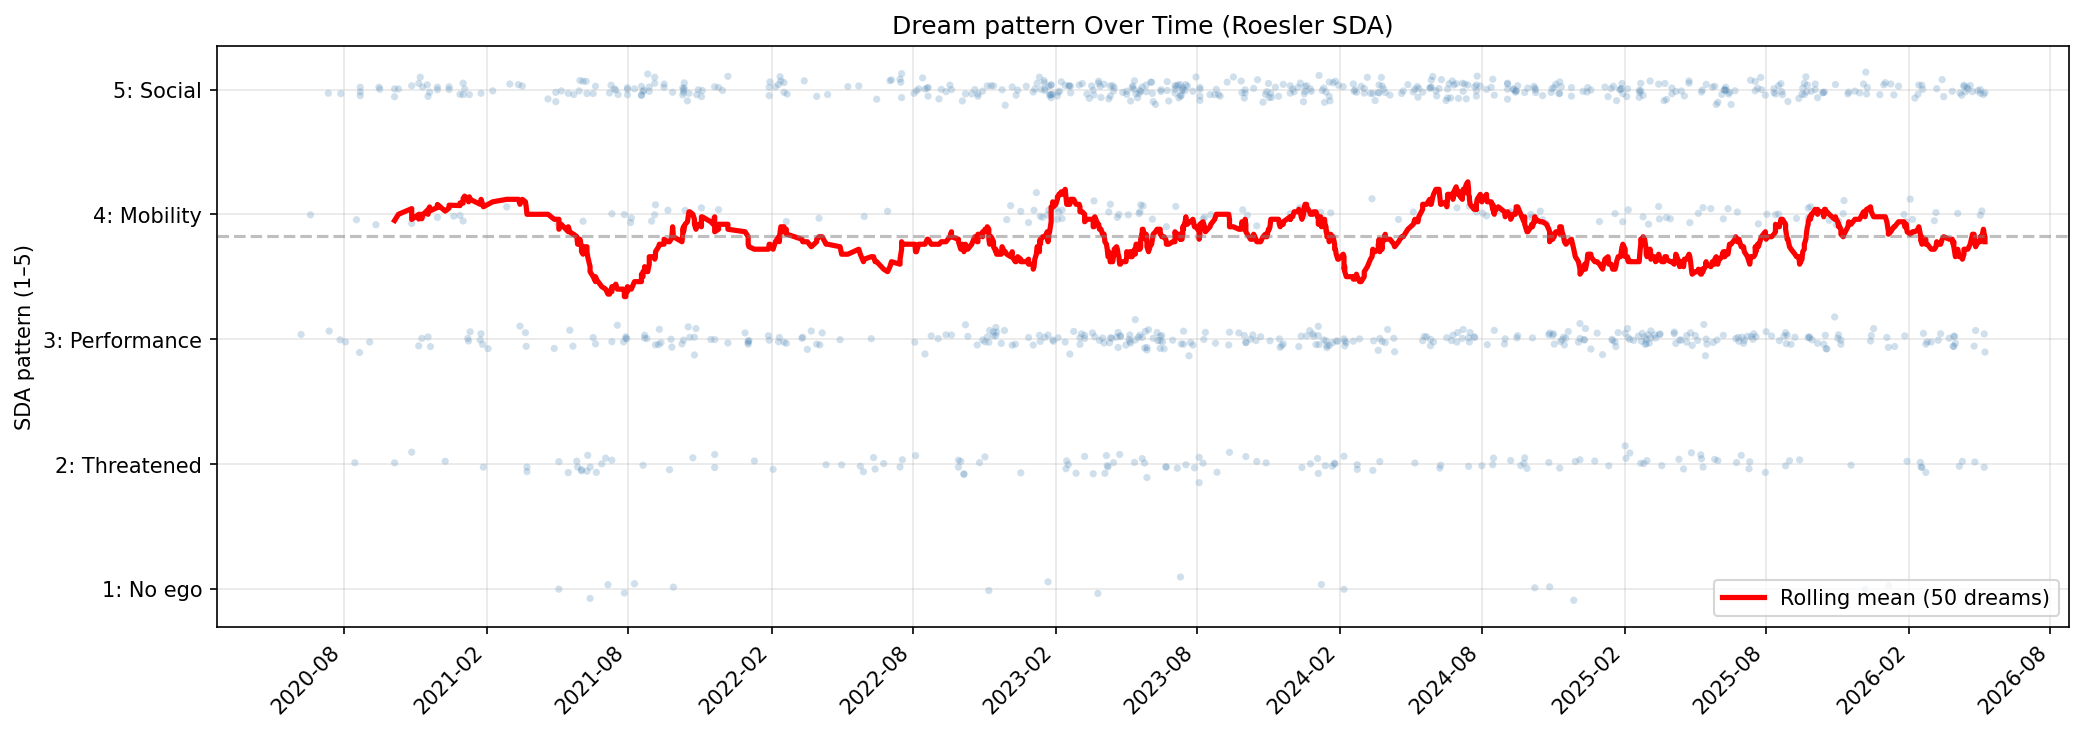
Pattern dynamics over time with added jitter and a moving average of the last 50 dreams
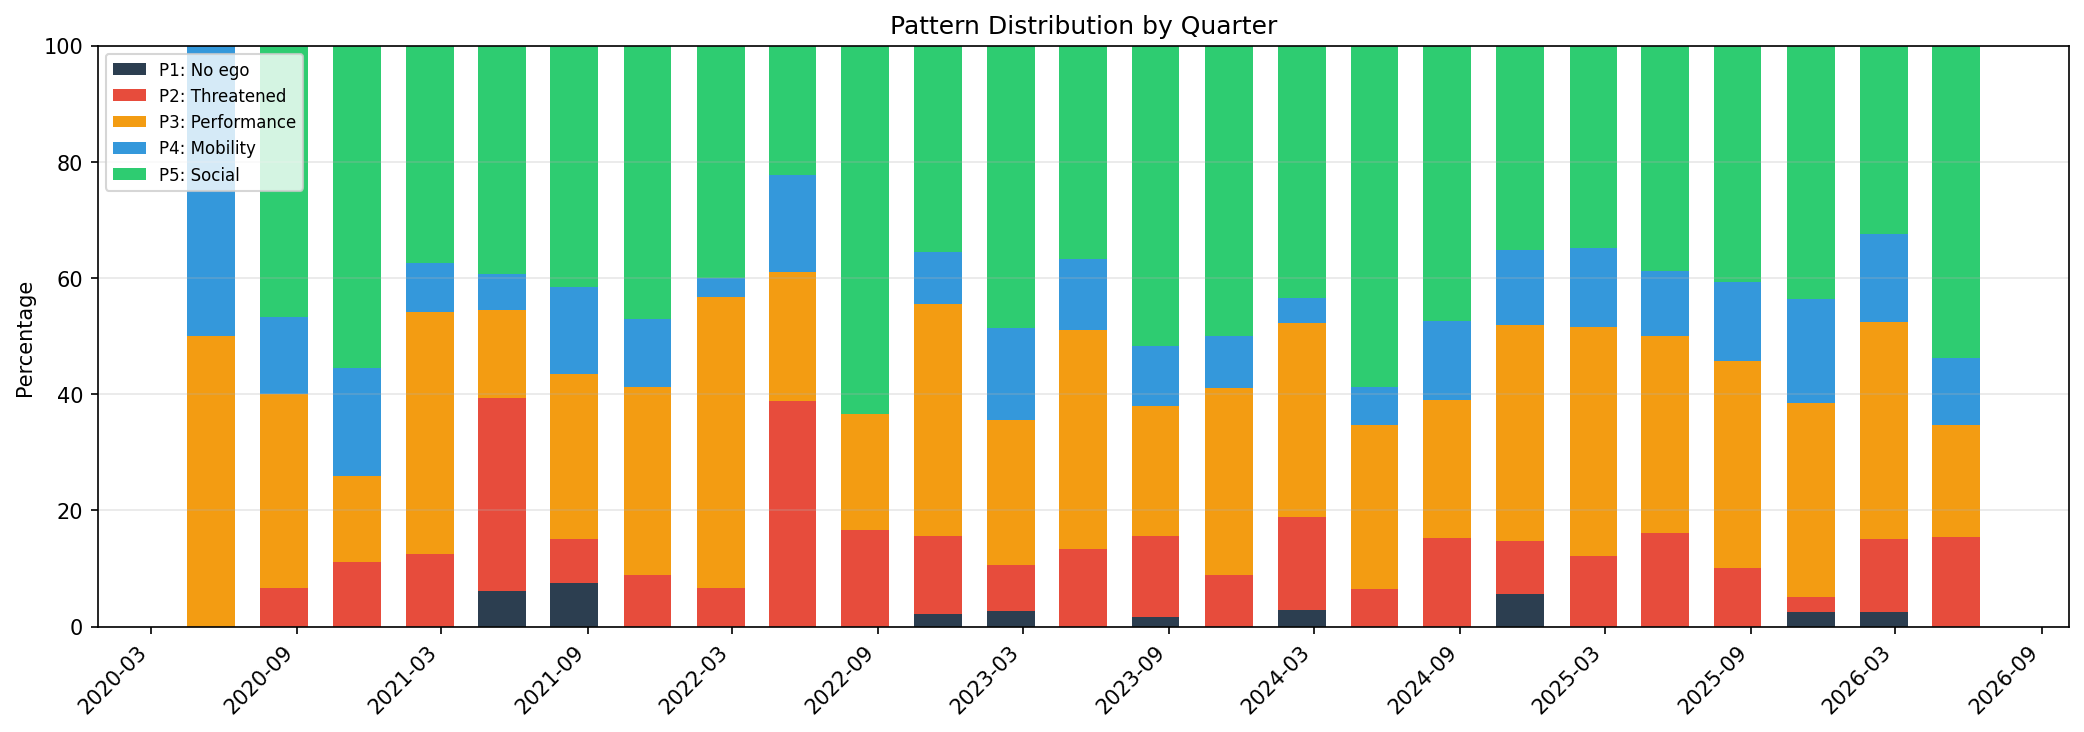
Pattern distribution grouped by quarter
Analysis of Results
We will apply three statistical analysis methods to the input data.
- The Mann-Kendall test applied to the chronologically ordered series of 1111 classified dreams found no statistically significant monotonic trend in the SDA pattern level over the 5.5-year observation period: τ=−0.0001, S=-31, p=0.9979, Sen's slope=0.000
- Ordinal logistic regression of the SDA model against time (in years) showed no significant effect, indicating that ego complexity in dreams did not systematically increase over the observation period: OR = 1.00, 95% CI [0.93, 1.07], p = 0.99
- A one-sided Mann-Whitney test found no significant difference in pattern levels between the first and second halves of the dream series: U=153 442, p=0.433, n₁=556, n₂=555
Conclusions
The patient assesses his course of therapy as fairly successful. Yet no correlation was found between undergoing therapy and changes in ego behaviour patterns in dreams.
Additional information about the study can be downloaded as an archive.[2]
References
Christian Roesler. Jungian theory of dreaming and contemporary dream research - findings from the research project ‘Structural Dream Analysis’ (Journal of Analytical Psychology, 2020, 65, 1, 44–62). Download
Archive with the database of classified dreams without the dream texts themselves (sequence number, date, classified pattern and dream subtype), a description of the classification process, and the Python code used for the statistical calculations and plots. Download